
 Most people have a general idea of what is meant by surface area, just as most people would be revulsed by the idea of dealing with any quantitative means to define or assess surface area.
In biological systems there are both advantages and disadvantages to increasing surface area, but we don’t usually think about our actions insofar as they use surface area to achieve strategic goals. We just seem to know the right thing to do, whether chewing food into smaller pieces or huddling together to preserve body heat on frigid days. Biological systems, whether in the human body or the tiniest microbe, are exquisitely designed to make the most out of its mass.
On the macroscopic level, people also have their preferences and their own opinions. Thick sliced or thinly sliced, or maybe just a slab.
The critics will say “It’s still bologna. You’ve just sliced it thinner.”
I think of the anti-surface area proponents as the slab eaters of the universe, or perhaps the buy and hold investors of the world. Not that there’s anything wrong with either of those atavistic behaviors. I’ve previously published an article that addressed the potential advantage of trading a single position over and over again, using Deere (DE) as a case study. For this article, the conclusions are based upon trading in excess of 70 stock positions, the vast majority of which were purchased on more than a single occasion during the time period in question.
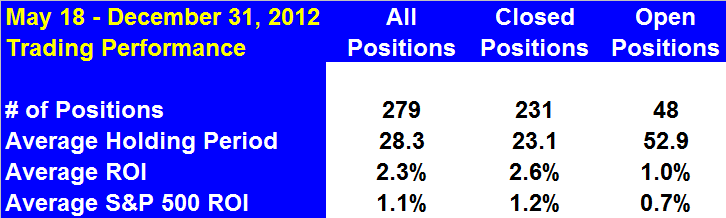
To illustrate my point about how increasing the surface area of your portfolio has great benefit, I’m going to get very personal. I do so by relaying the results of 279 trades, opening new positions (or selling puts), that were recommended to subscribers of Option to Profit from its initial availability to the general public on May 18, 2012 to the last day of trading in 2012. Almost without exception, new positions had call contracts sold against them, resulting in a regular stream of income generation.
The statistics do not include commission or fees and are based upon prices in effect when the Trading Alerts were transmitted. In addition, for comparative purposes, each trade was evaluated on the basis of the difference between the S&P 500 level on the opening of the day the trade was initiated to the closing level on the day the trade was concluded.
How can I prove that I transmitted this information? That’s probably not terribly important, as the truly cynical reader can corroborate price ranges on the dates of trades. Besides, this is more about the concept of surface area than my ability to select winning stocks. I have often said that I am a terrible stock picker and have terrible timing to boot, but exploiting surface area makes up for those shortcomings. Just as in biological systems, there’s not much reason why increasing the surface area of your portfolio shouldn’t be a reflex action.
Many are familiar with the old strategy of staggering maturity dates of savings instruments and bonds in order to avoid being entrapped in low rates that may occur at a moment in time that happens to coincide with your need to reinvest. Staggering the expiration dates is a form of increasing surface area. Most people have no problem accepting the premise that doing so is not a terribly bad idea, due to uncertainty in predicting the future. There’s no reason why that rational thought process can’t be transferred to one’s portfolio.
Of course, if you’re overly concerned about such a strategy with your savings right now, you’re probably not reading this article or very many regarding stocks and investing strategies.
Here are the salient summary statistics (see details). During this period of time the S&P 500 advanced 9.3% and is used as a measure to reflect the results that may be experienced by slab lovers. The Option to Profit ROI is based upon returns from the shares themselves and any option premiums and dividends received throughout the holding period.
 Due to a peculiar defect that I have, which is to not accept stock losses, I’m very reluctant to sell losing positions other than to clear them out at year end for strategic tax losses. I know Bernard Baruch wouldn’t agree, but my temperament doesn’t get rattled when peering at a large paper loss. Before someone criticizes me for being so blind, I remind myself that as a terrible stock picker and timer, had I followed the 10% rule and sold positions as they demonstrated such losses, I never would have seen their resurrections and subsequent contributions to my positive bottom line.
Patience. That is as good a strategy as any and is a word that I repeat to myself while peering at positions in Microsoft (MSFT), Intel (INTC) or any positions that have fallen to a point that I’m unable to find a rewarding option premium at a strike price and contract duration that doesn’t cause me to revulse.
Over the course of 231 closed trades, only 6 were sold for losses. Of 48 currently open positions, an additional 13 (27.1%) are demonstrating paper losses after having accounted for all income streams.
Certain stocks are core positions, in that whenever assigned, I looked for any opportunity to repurchase them. Included in that category are Caterpillar (CAT), Freeport McMoRan (FCX), Morgan Stanley (MS), Halliburton (HAL) and others. Occasionally, what had been a core position would become too expensive to repurchase, such as Goldman Sachs (GS) or Abercrombie and Fitch (ANF), but would be welcomed back at a more reasonable re-entry point.
For purposes of evaluation, I’ll keep the math simple and will rely on some assumptions that may further over-simplify matters, but remain useful to illustrate a point.
There were 228 days during the observation period. For the buy and hold investor, using the S&P 500 as a proxy, the return for that period was 9.3%.
For the bologna slicing investor, the average holding period of a position was 28.3 day during which time the average position returned 2.3%. Assuming turnover of the portfolio based upon an average holding period, that turnover would have occurred 8 times, with each such turnover returning the average of 2.3% ROI.
As opposed to the experiences of many traditional investors, a single stock is not likely to skew your results. So often a really great year is defined by a single “home run,” just as a single disaster can ruin an entire year. You neither need an Apple (AAPL) in your portfolio to flourish, nor be in jeopardy if it suddenly flails.
However, when you increase the surface area of your portfolio, an individual position is more likely to be indistinguishable from the rest. Rather than being potential homerun hitters, they are all just trying to get on base. Over and over again. Even the experience of Groupon (GRPN) or Hewlett Packard (HPQ) may not be enough to quench the rally bought about through the little deeds of so many.
Pragmatically, it may be easier to think of an entire portfolio turning over in unison, but it is really an ongoing turnover. Various positions come and go just as quickly as options expiration Fridays come and go. In fact, while my sweet spot is a 20-40% turnover on any given Friday, much more than the upper limit suggests that you will be under-performing the market, despite accruing option premiums, by virtue of having missed out on share gains. On the other end, much less than 20% frequently may mean that your out-performing the market, thanks to your premiums, but the market itself is flailing and your net assets may be diminishing.
When all said and done, whereas buy and hold returned 9.3%, helped quite a bit by a 1.7% surge on the final trading day of the year, the increased surface area portfolio would have returned 18.4%.
What is notable is that many of the stocks that were purchased beginning as early as May 2012 are still being purchased today at prices that are not terribly distant from where the process started. While Points A and B may not be far apart, the cumulative path traveled by many of these stocks has been considerable. By increasing the surface area of your portfolio and eschewing a buy and hold strategy, the inherent energy stored in each stock price bounce can be realized through the judicious sale of options.
As long as drawing a parallel to biological systems, selling options also helps to create a form of natural selection. The fittest stocks, those that show share gains will be assigned and result in realizing profits. Those not assigned still live to see another day and aren’t really eliminated, but rather given the opportunity to allow time to restore it to fitness, as well, often returning to strength along with its out of favor sector mates.
Rather than depending on the greedy investor to decide to sell shares, or as frequently happens, miss the opportunity to sell shares at profit, as a result of greed, setting a strike price prior to the emotion of seeing a price gain allows any subsequent gains to be captured.
While the model demonstrated here is certainly not to be construed as a guarantee of returns, it may certainly be reasonable to consider altering an investment strategy that is overly reliant on tremendous performances by a small number of positions, just as it is reasonable to protect one’s portfolio from being held hostage by a single horrid loser.
Instead, hand your portfolio over to the chorus, where all are talented, but none ever get the chance to steal the show. Once in your chorus, they are free to leave and free to come back to recount good times.
To paraphrase Sting, “If you love a stock, set it free.”
Too many metaphors?
